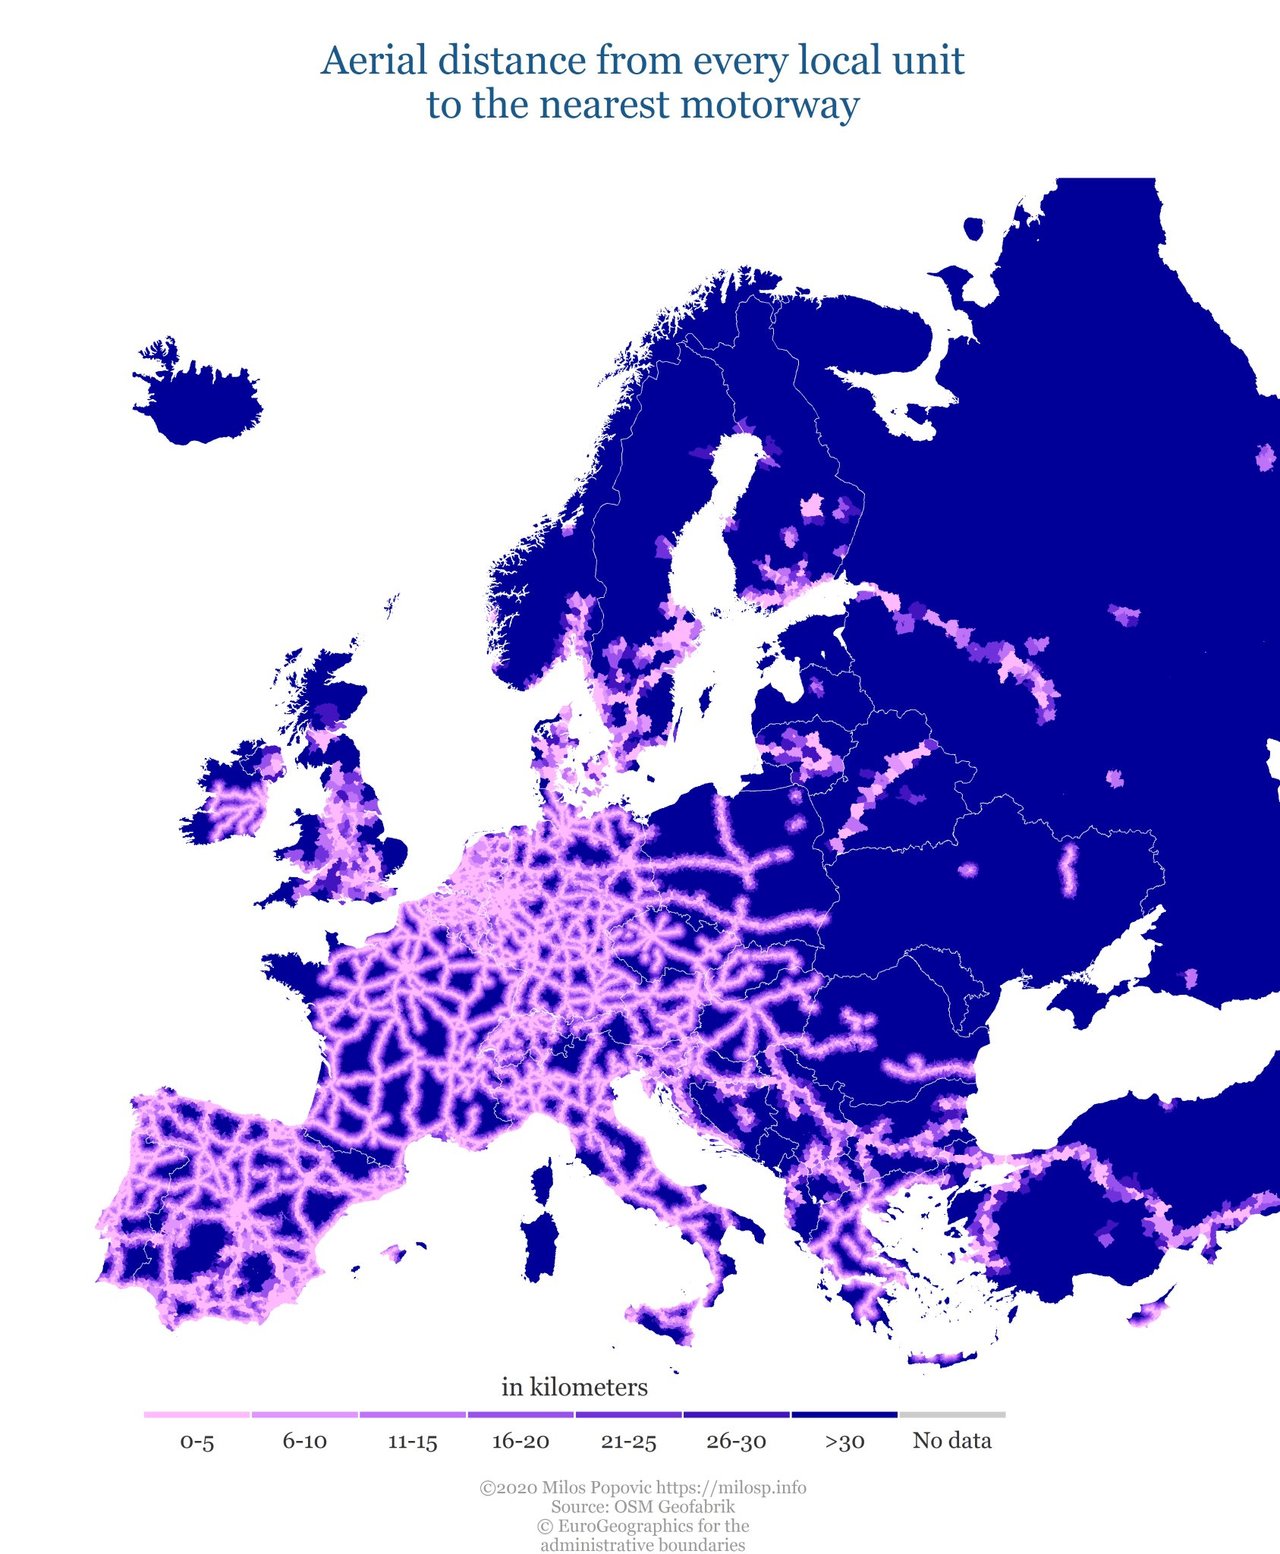
How far is the motorway from the centroid of every local admin. unit in Europe. Check out my latest map! #roads #transport #dataviz #datascience #bigdata #maps #rstats https://t.co/wmS7LEXspJ
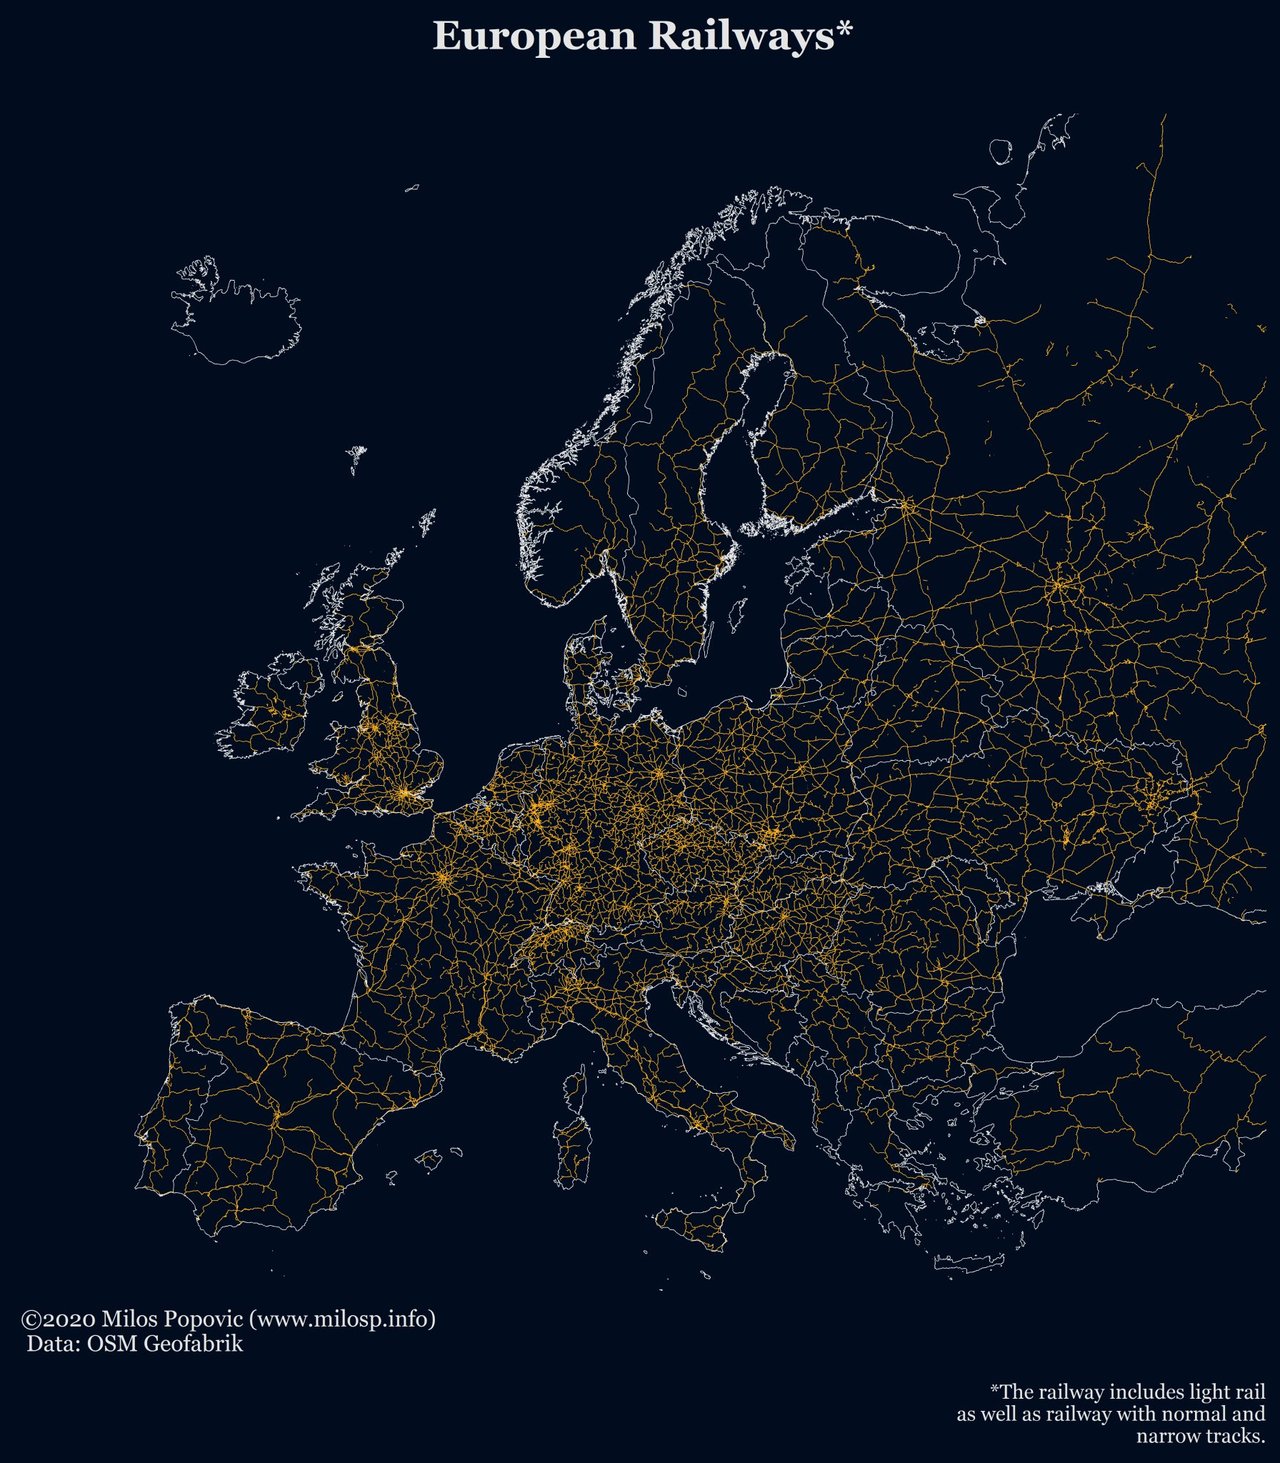
Download your high-quality, crisp image of European railways at http://milosp.info/maps/full/eur_rail.png #railway #Railways #transport #infrastructure #europe #DataScience #dataviz #maps #rstats #gis
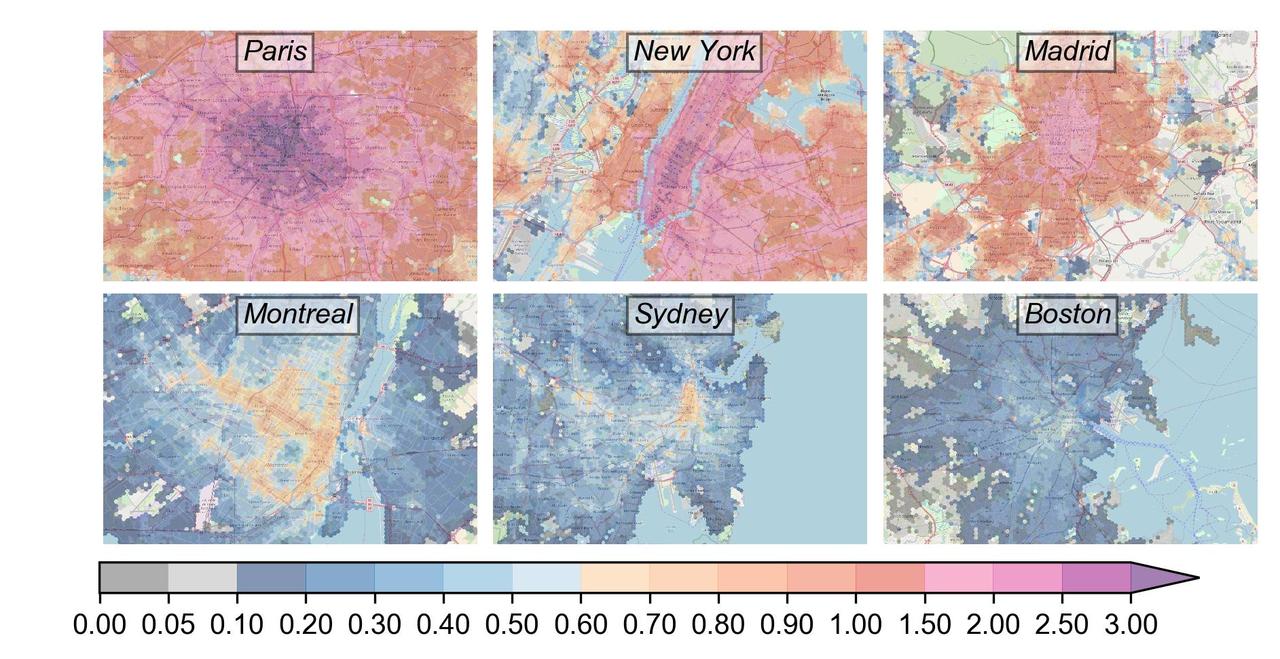
Our last work on the performance of urban public transport is out! What are the best performing cities? Is the public transport well distributed among people? Check it out: https://royalsocietypublishing.org/doi/10.1098/rsos.190979 http://www.citychrone.org #transport #citychrone #DataScience #dataviz #maps https://t.co/M7PEwLV1qg
.@jtleek "ggplot is the third rail of #DataScience" on the crazy reaction to his blog post: http://simplystatistics.org/2016/02/11/why-i-dont-use-ggplot2/ #JSM2016 #dataviz
More than 50% of deaths in US in age group 15-30 related to transport & intentional injuries #dataviz #datascience https://twitter.com/plotlygraphs/status/651108233751470080